
|
||
|
|
ResearchMy research interests embrace different aspects of solid earth geophysics including, but not limited to: earthquakes, faults, volcanoes, early warning, seismic noise and seismic imaging. I explore various questions related to earthquake and volcano seismology leading to a better understanding of physical phenomena involved in tectonic and volcanic environments. The insights and techniques gained from such studies can be applied to reduce the impact of natural phenomena on our society (e.g., earthquakes, tsunamis, volcanic eruptions).
Probabilistic fault slip inversionDespite the ever-increasing amounts observations available in the age of big data, observations are often limited to smaller spatial extents or timescales than the studied processes. In this context, the answers to many problems lie in models that cannot be uniquely constrained given available data. Such an inference process leaves unanswered basic questions about any model: How unique is a given model? How much does each observation contribute to the model? What is the impact of errors in the model? How reliable are predictions made from the model? These questions can be reliably answered only with access to the whole posterior distribution of the model space provided by Bayesian methods. While not new to geophysics, this approach has had limited application in earthquake finite-fault source inversion problems mainly because of the large computational resources involved (Tarantola and Valette, 1982). We recently started to tackle high-dimensional problems by using both innovative Markov Chain Monte Carlo (MCMC) techniques and cutting edge computational approaches using GPUs. In collaboration with Mark Simons's group at Caltech, we recently developed an algorithm called ALTAR which allows us to sample high-dimensional problems in a parallel computing framework. Our approach is based on a meticulous error analysis accounting for uncertainty in the Green’s functions while avoiding non-physical spatial smoothing over the slip distribution. More precisely, we recently developped a general framework to explicitly handle Earth model inadequacies when computing geodetic and seismic predictions (forward models) in fault slip inversion problems (Duputel et al., 2012, 2014). We recently started to apply this new formalism to actual observations in both co-seismic and interseismic cases (Jolivet et al., 2014; Jolivet et al., 2015; Duputel et al., 2016). 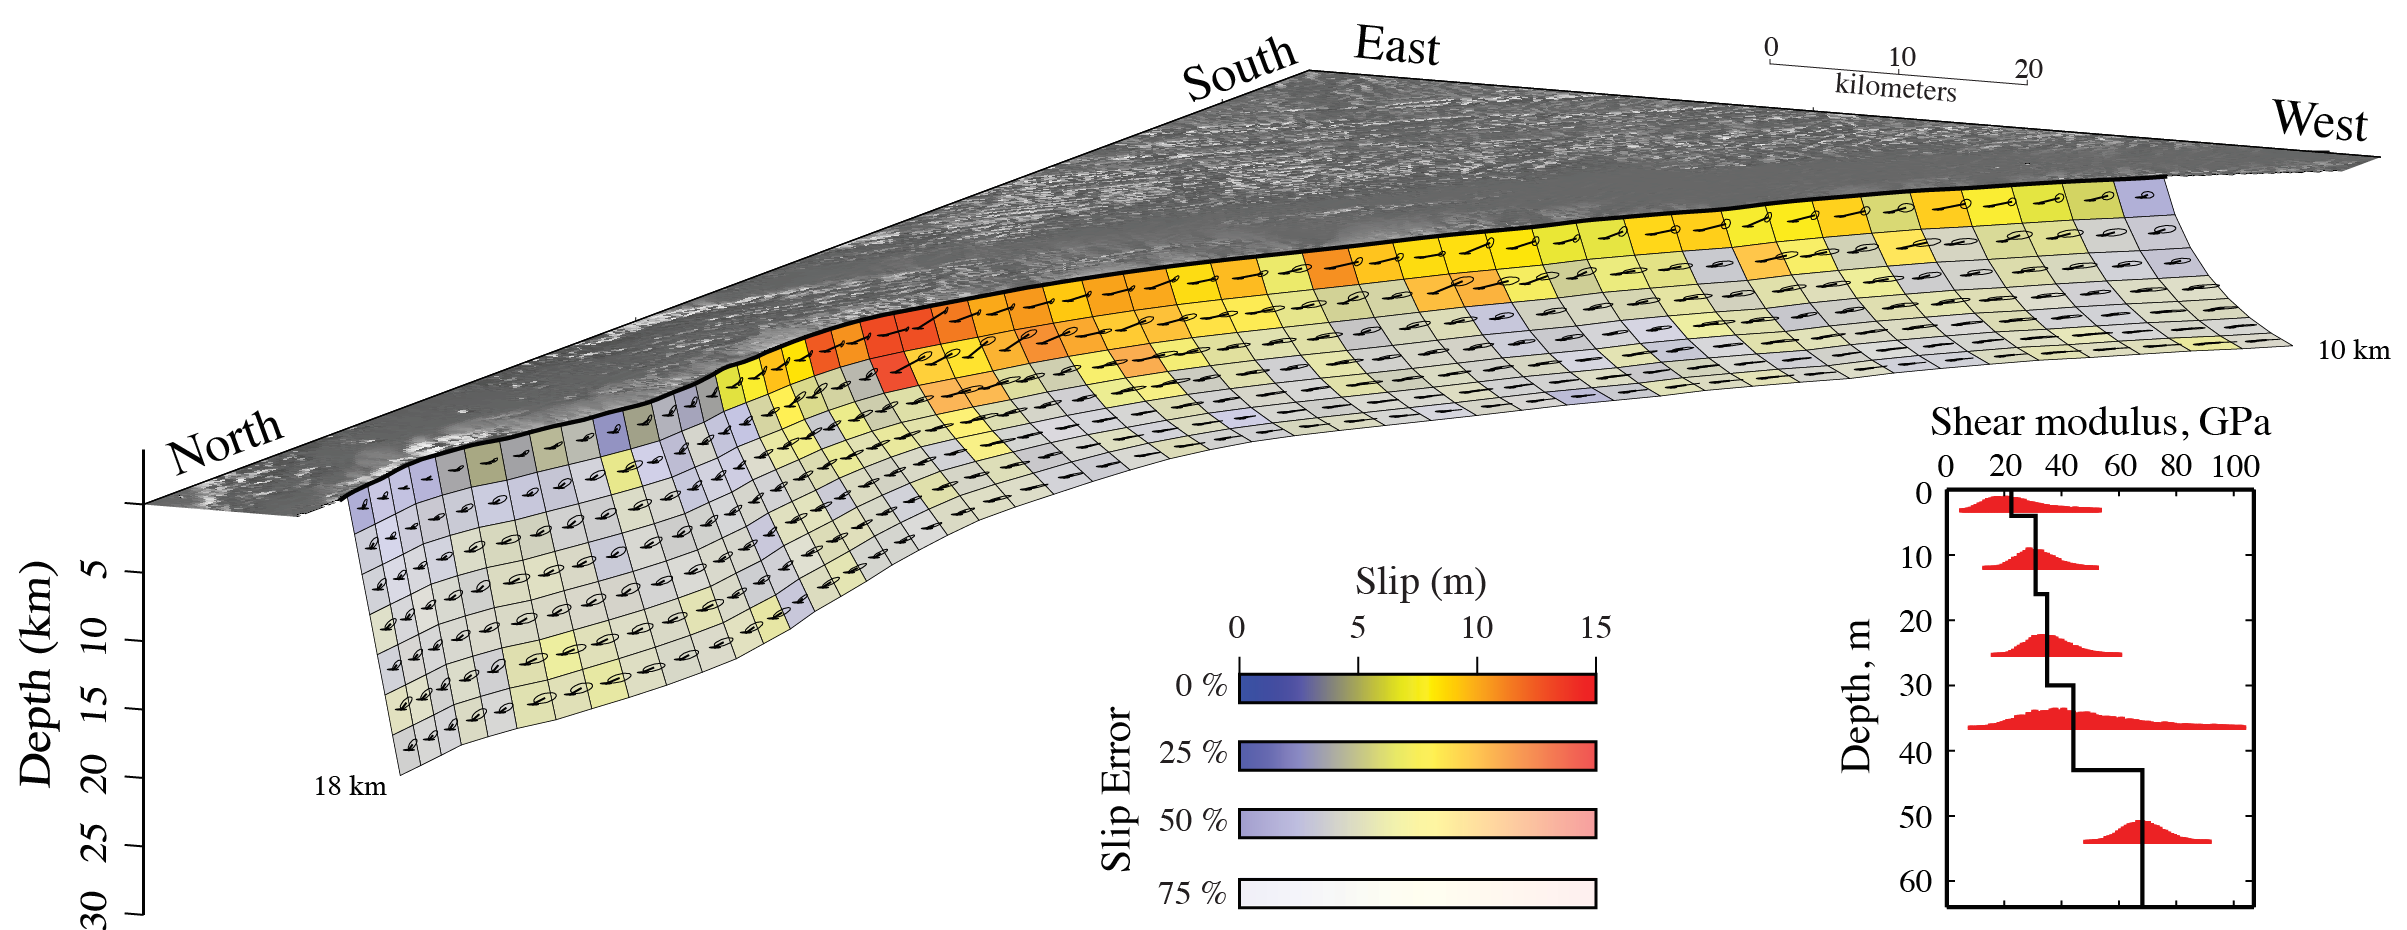
Slip distribution obtained for the Mw 7.7 Balochistan earthquake on September 24th, 2013 from satellite based observations of the co-seismic displacement (Jolivet et al., 2014). The color of each subfault patch indicates the slip amplitude, while the brightness represents relative total slip uncertainty. Arrows and their associated 2-σ error ellipse indicate the slip direction. The inversion was performed using the ALTAR Bayesian algorithm and the approach of Duputel et al. (2014) to account for uncertainty in the shear modulus structure shown by the red histograms on the right (Duputel et al., 2014). Multiple-point-source analysis of large earthquakesIt is known that many large earthquakes involve significant rupture complexity, with the most well-known recent events being the Mw=7.1 1999 Hector Mine earthquake the Mw=8.1 2009 Samoa earthquake and the Mw=8.6 2012 Sumatra earthquake. Rupture branching onto multiple subfaults are frequently observed, for example, during the Mw=7.3 1992 Landers earthquake, during the Mw=7.8 2001 Kunlun earthquake and more recently during the Mw=7.2 2010 El Mayor-Cucapah earthquake. Such complex ruptures are generally difficult to characterize and several month are often necessary before having a reliable description of the source. To account for the source complexity of large earthquakes, I developed a multiple-point-source moment tensor inversion based on long-period seismic waves. This method allows to retrieve the subevent moment tensors, locations (latitudes, longitudes, depths), time delays and half durations using a modified version of the Neighborhood Algorithm sampler (Sambridge, 1999). In Duputel et al. (2012, cf. publications), we validate this method for the Mw=8.6 2012 Sumatra earthquake. Our preferred two-point-source model for this earthquake is shown in the figure bellow as the green mechanisms an circles labeled I (first subevent) and II (second subevent). 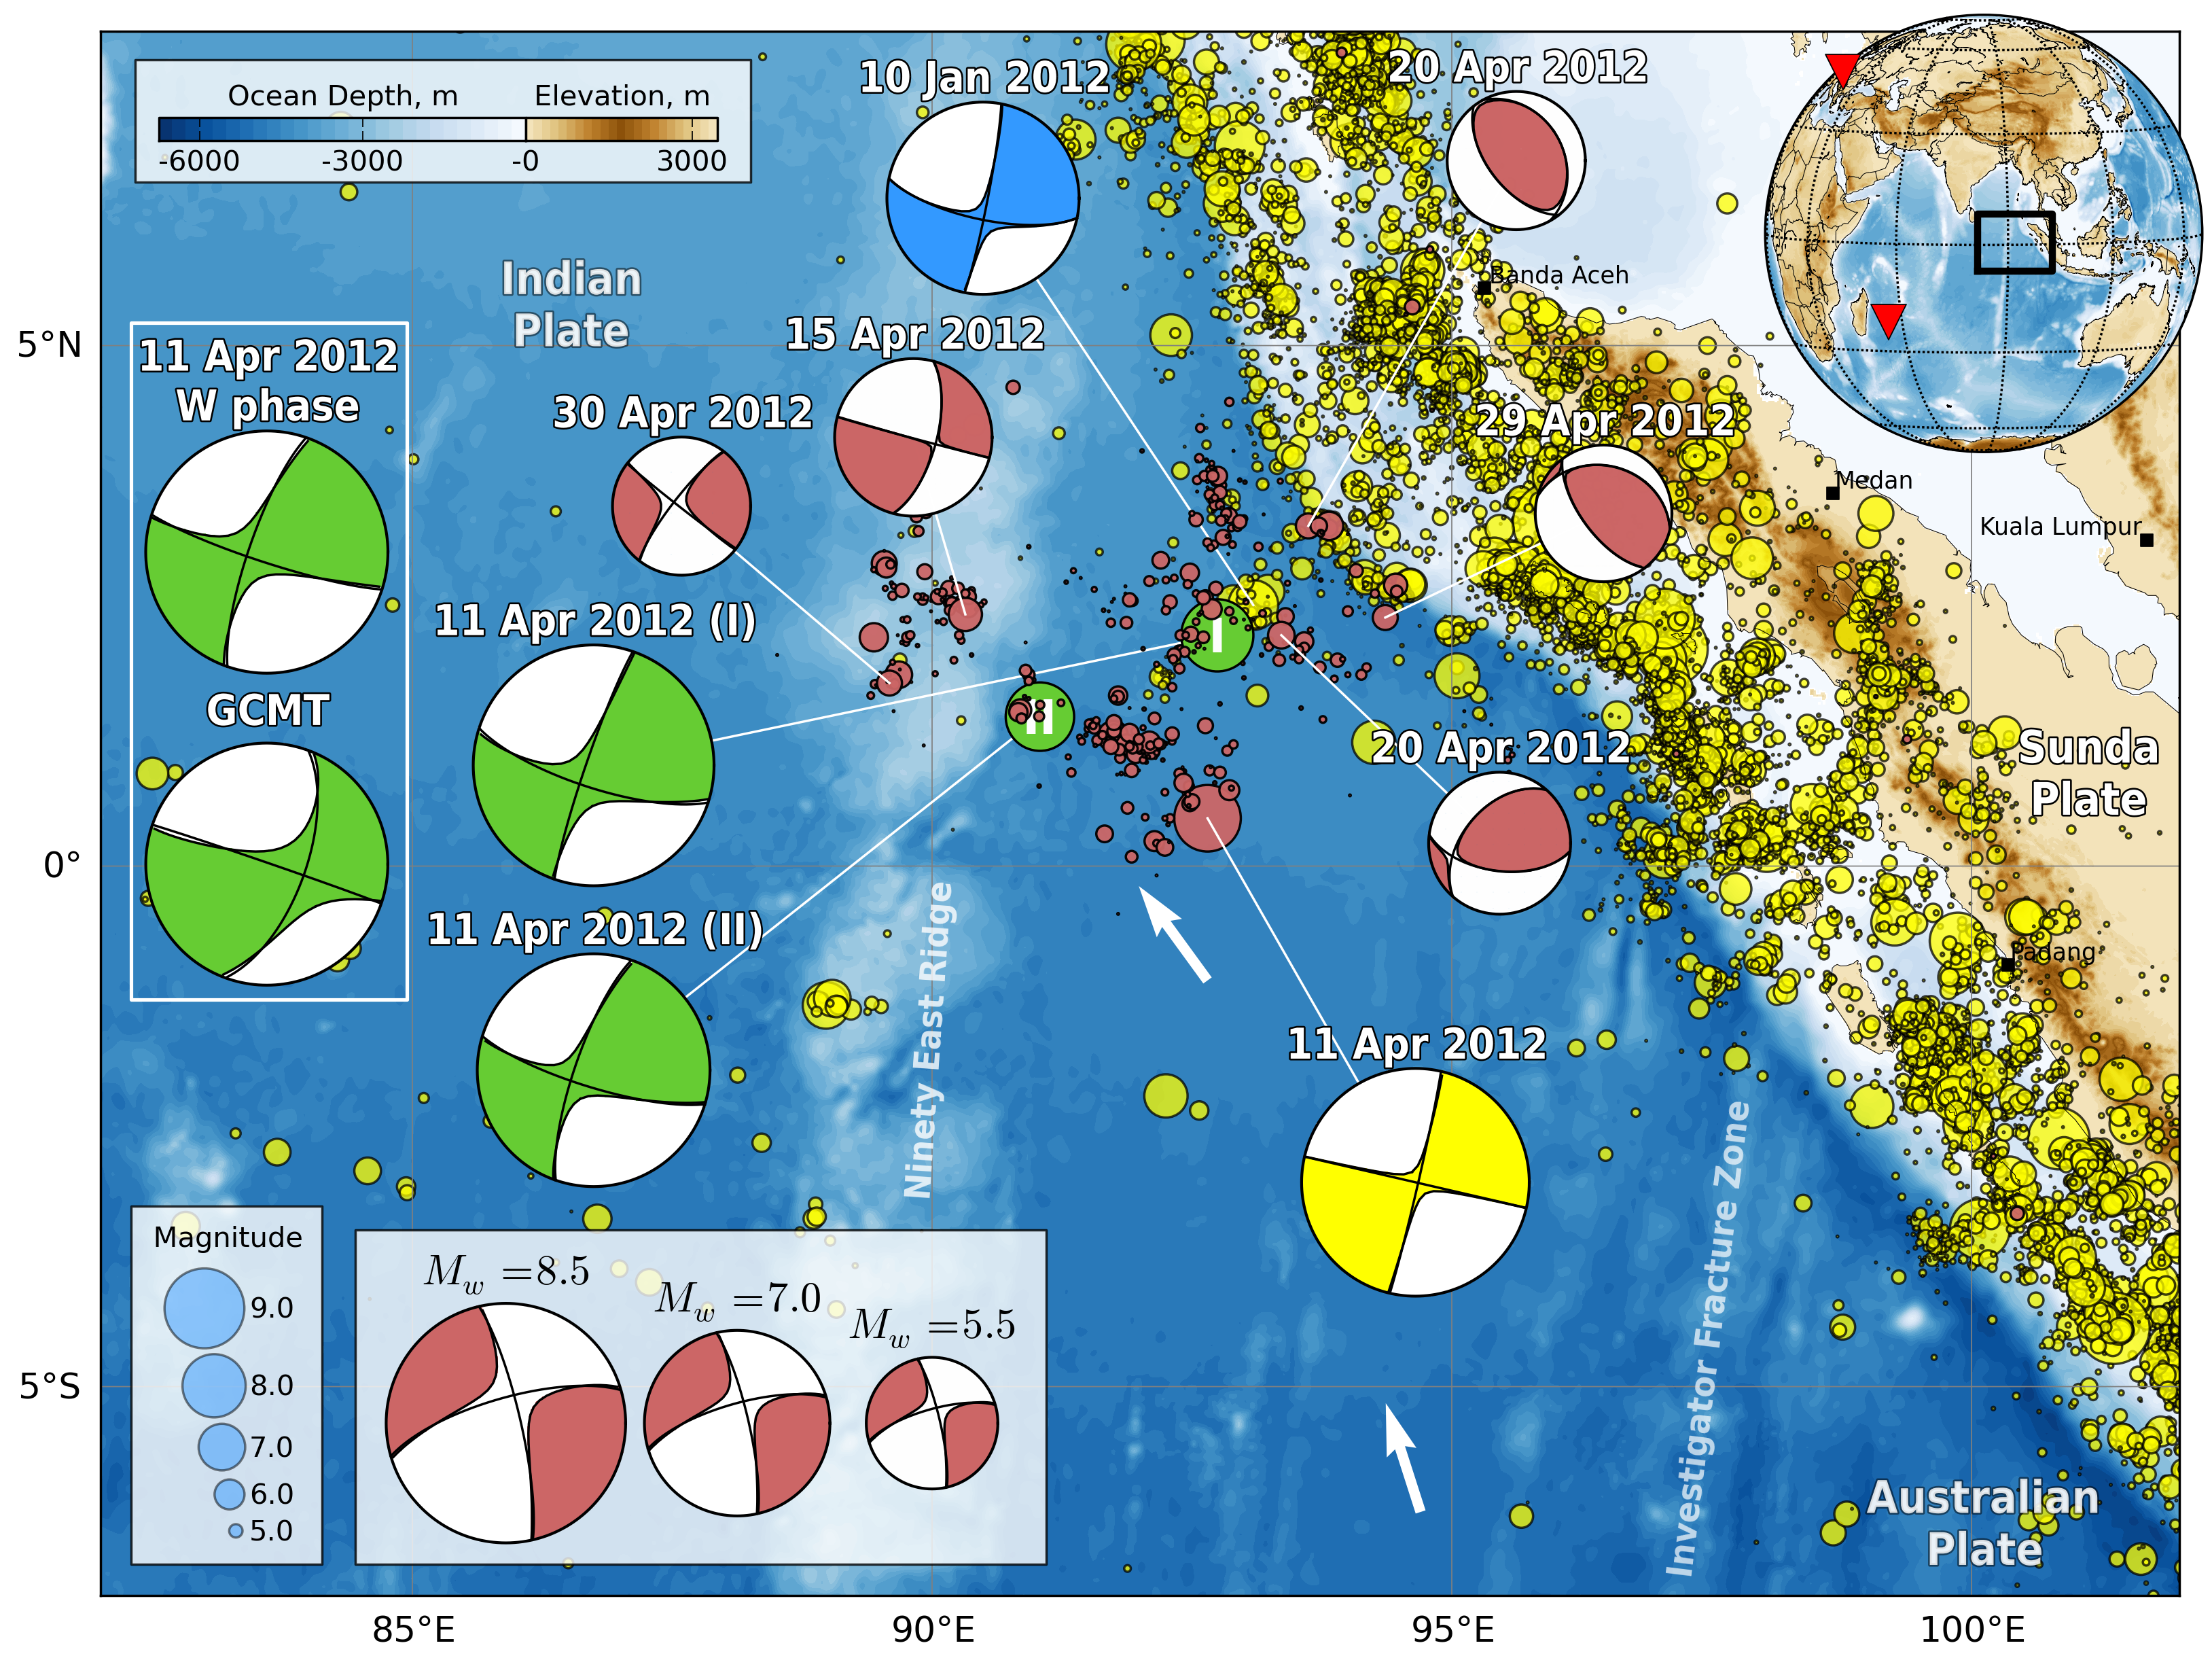
Map of the 2012 Sumatra great earthquake region. The 11 April 2012 mainshock can be decomposed into two subevents separated by about 200 km (green mechanisms and circles labeled I and II). The W phase and Global CMT (GCMT) single-point-source solutions for the mainshock (inset green mechanisms), the W phase solutions for the 10 January foreshock (blue mechanism), for the Mw=8.2 aftershock (yellow mechanism) and for the 5.8 ≤ Mw ≤ 8.2 aftershocks (red mechanisms) are shown. Yellow circles indicate the earthquake epicenters and magnitudes from the National Earthquake Information Center (NEIC) catalog between 1 January 1973 and 10 April 2012. Red circles show the events since the Mw=8.6 11 April 2012 earthquake through May 2012. White arrows indicate the direction of motion of the Australian plate relative to the Indian plate at about 13 mm/yr. W phase source inversion for moderate to large earthquakesConsiderable effort has been made in the last two decades regarding the design and implementation of tools aimed at fast characterization of earthquake sources. But until recently, it still took several hours to determine the first order attributes of a major earthquake (e.g. Mw ≥ 7.5), even in a well instrumented region. A very good example is the Mw=9.2 2004 Sumatra-Andaman earthquake for which several days of discussion were necessary before having a concensus on the event magnitude. During my Ph.D. thesis, I developped a method to speedup the source analysis of such large events. This method is based on the W phase, a very-long-period phase (100 - 1000 s) starting at the same time as the P-wave. The W phase is conspicuous on broadband displacement records before the surface-waves arrivals and it can be interpreted as the superposition of the first overtones of the Earth normal modes at long period. In Duputel et al. (2012, cf. publications), we show the robustness of this method at teleseismic distances by inverting for the centroid moment tensor of Mw ≥ 6.0 earthquakes reported globally between 1990 and 2010 (∼2500 events, cf. figure bellow for Mw ≥ 6.5 earthquakes). Several international collaborations have been established in the last three years for the real-time implemention of the method. The W phase algorithm is now used routinely in several warning centers like the Pacific Tsunami Warning Center (PTWC) or the United States Geological Survey (USGS) for the rapid source characterization of large earthquakes. During the recent Tohoku-oki earthquake, the W phase method provided a first Mw=9.0 estimate 20 min only after the origin time, while most other magnitude calculations severly underestimated the true event size. One of the future improvements of the W phase inversion method is to speedup the source analysis using regional data. We recently pointed out the possibility to use F-NET Japanese stations within ∆ ≤ 12.0° to obtain a solution ∼6 min after the origin time. In Rivera et al. (2011, cf. publications), we show the possibility of using high-rate GPS data to decrease this delay to ∼5 min if the data is available in real-time. The algorithm is currently under implementation in several places like in Mexico, South-California and Japan. Another perspective related to the W phase algorithm is the possibility to rapidly characterize the source finiteness. However, to preserve the robustness of the inversion, we should extend the model with a minimum set of well chosen additional parameters on which we can have rapid and reliable estimates. 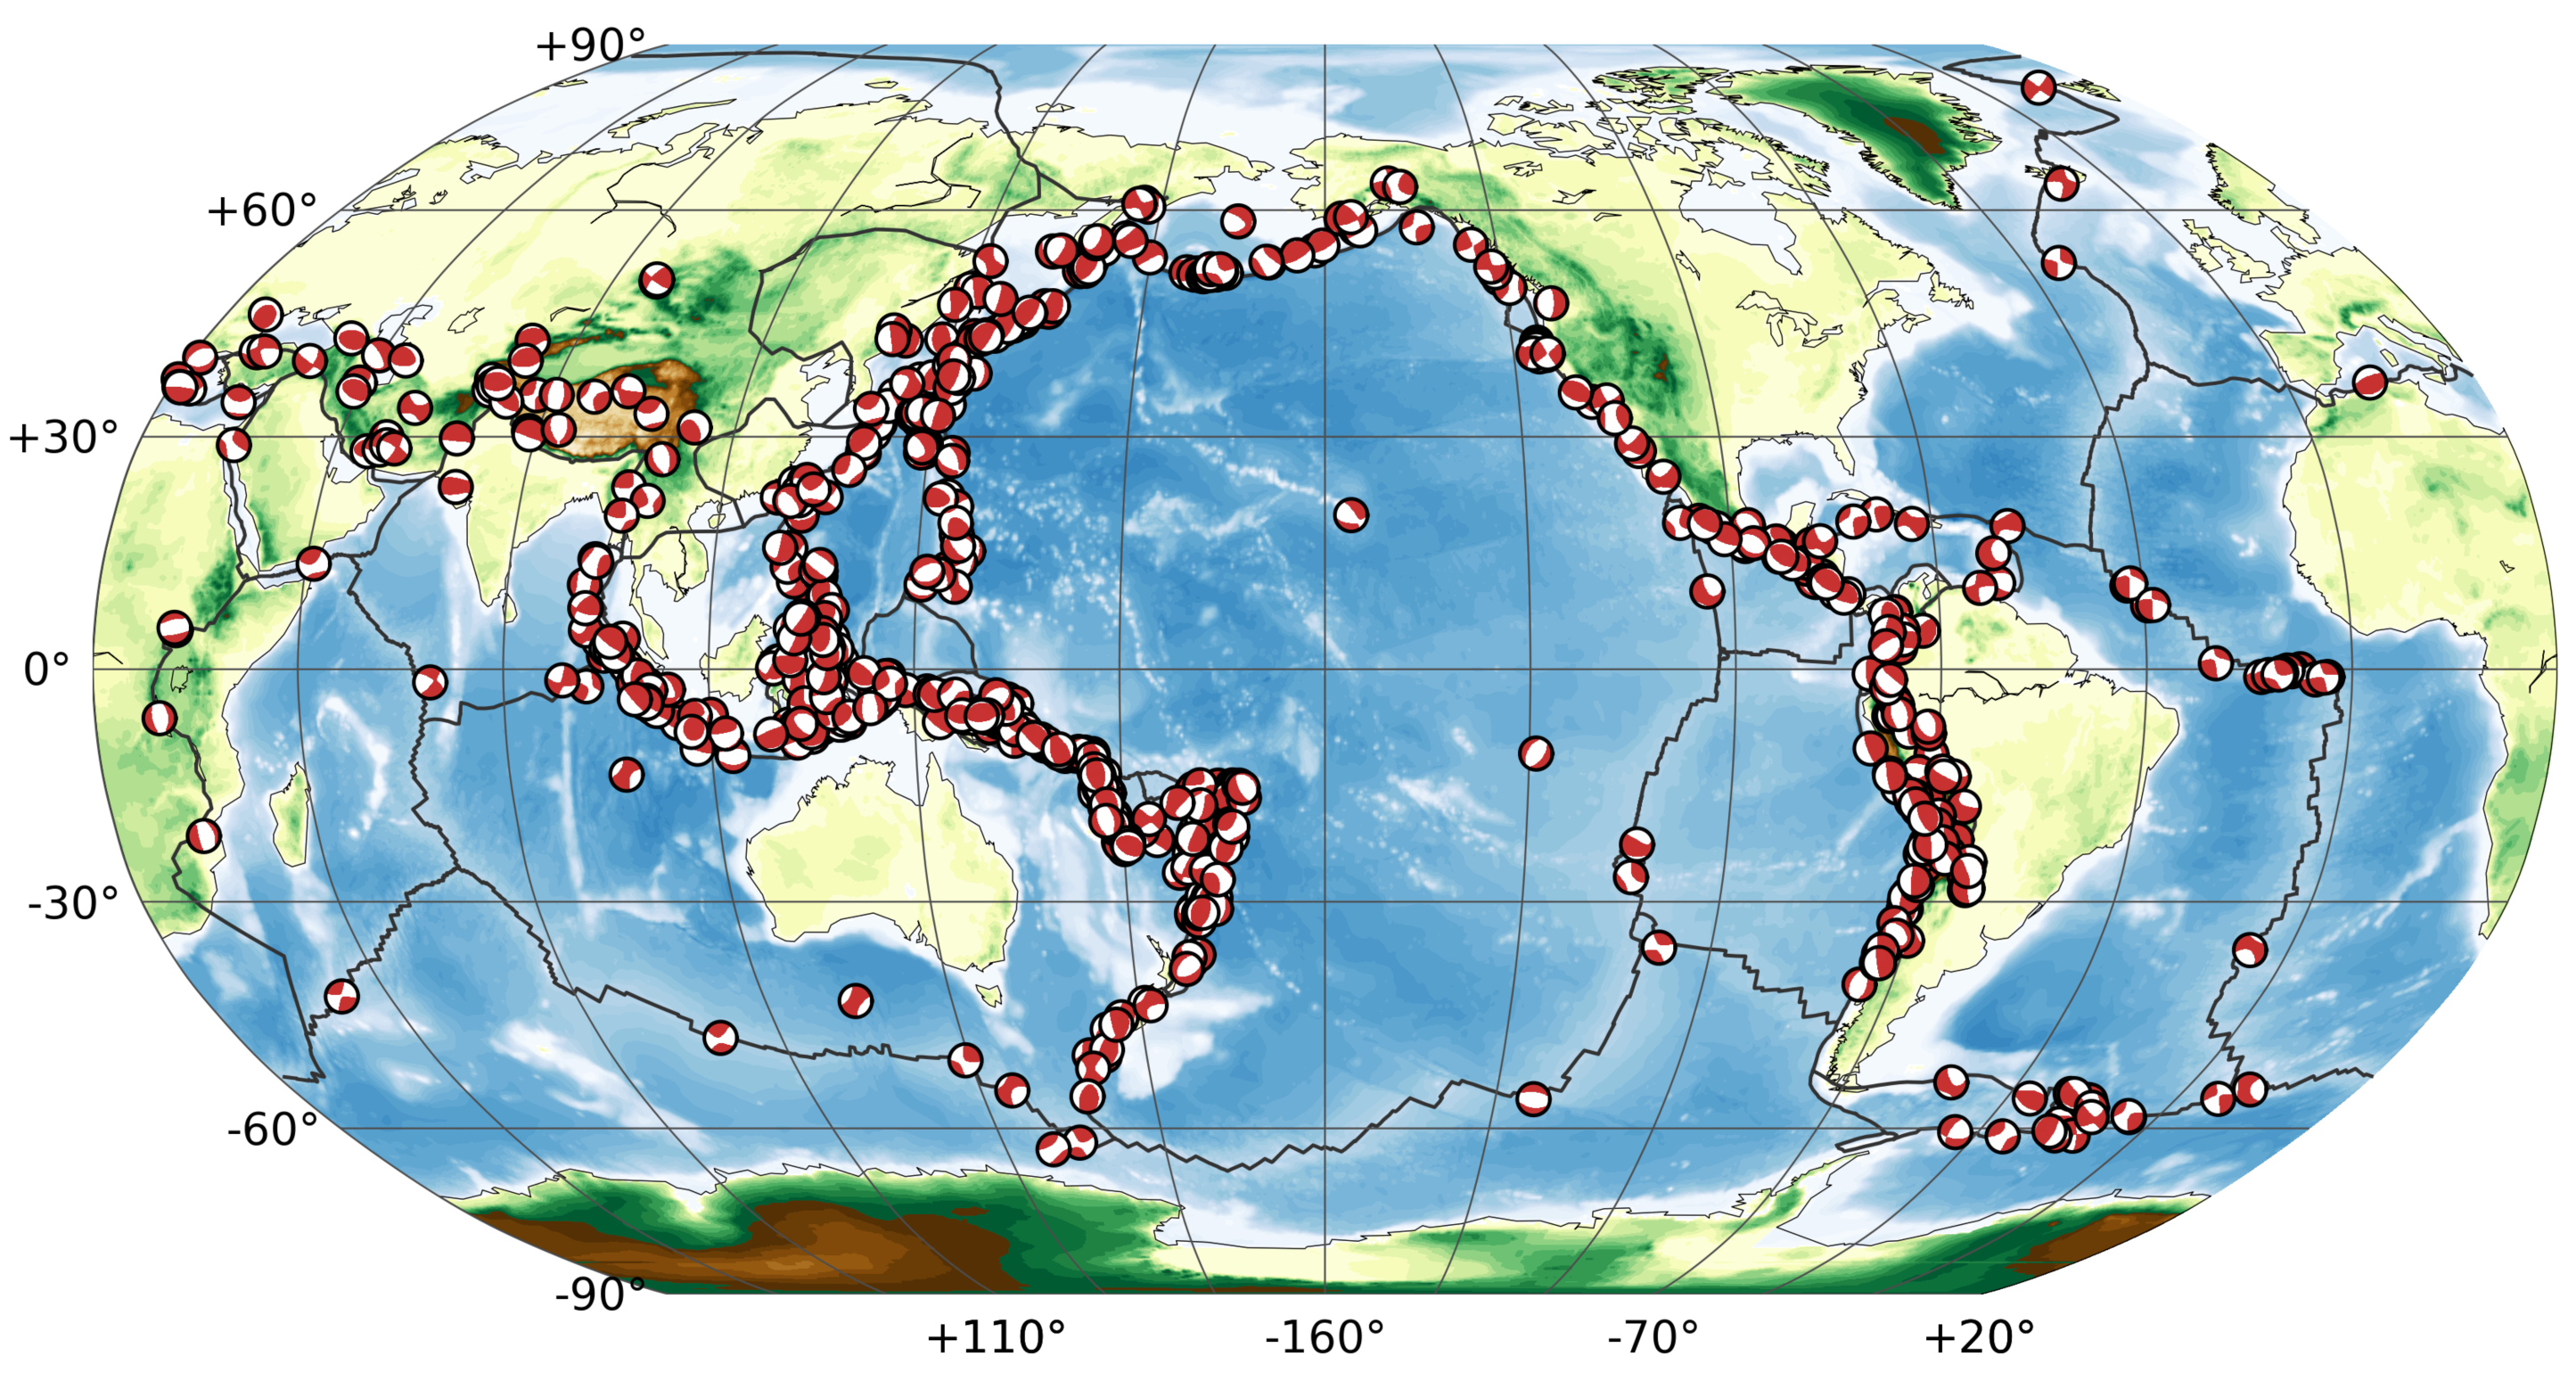
W-phase CMT solutions obtained for all Mw>=6.5 earthquakes occurring between 1990-01-01 and 2011-01-01. Volcano-tectonic seismicityEruptions at basaltic volcanoes are often preceded by abundant seismic activity, which usually serves as one of the indicators of an impeding eruption. Beyond the usefulness of seismicity rate monitoring as a short-term eruption precursor at active volcanoes, earthquakes can also help to understand volcano dynamics. Volcano-tectonic (VT) earthquakes represent brittle failures within the volcanic edifice. While these events are related to stress perturbations caused by intruding magma bodies, a clear link between the stress source and the occurrence of these earthquakes is still elusive. A typical limitation to decipher the actual link between the magma feeding system and the occurrence of VT events is the lack of precise observations of these latter events. Volcanoes are associated with various seismic signals (e.g., long-period events, tremor, and rockfalls), which might mask the signature of VT events if they occur in at the same time. The complexity of the seismic signals, combined with the low signal-to-noise ratio for small events, results in difficulties for both the detection and precise location of VT earthquakes. Furthermore, VT events often occur in very active swarm episodes that render the identification of each separate event difficult. In these circumstances, it is usually not possible to detect and locate earthquakes accurately during preeruptive crises using standard techniques. 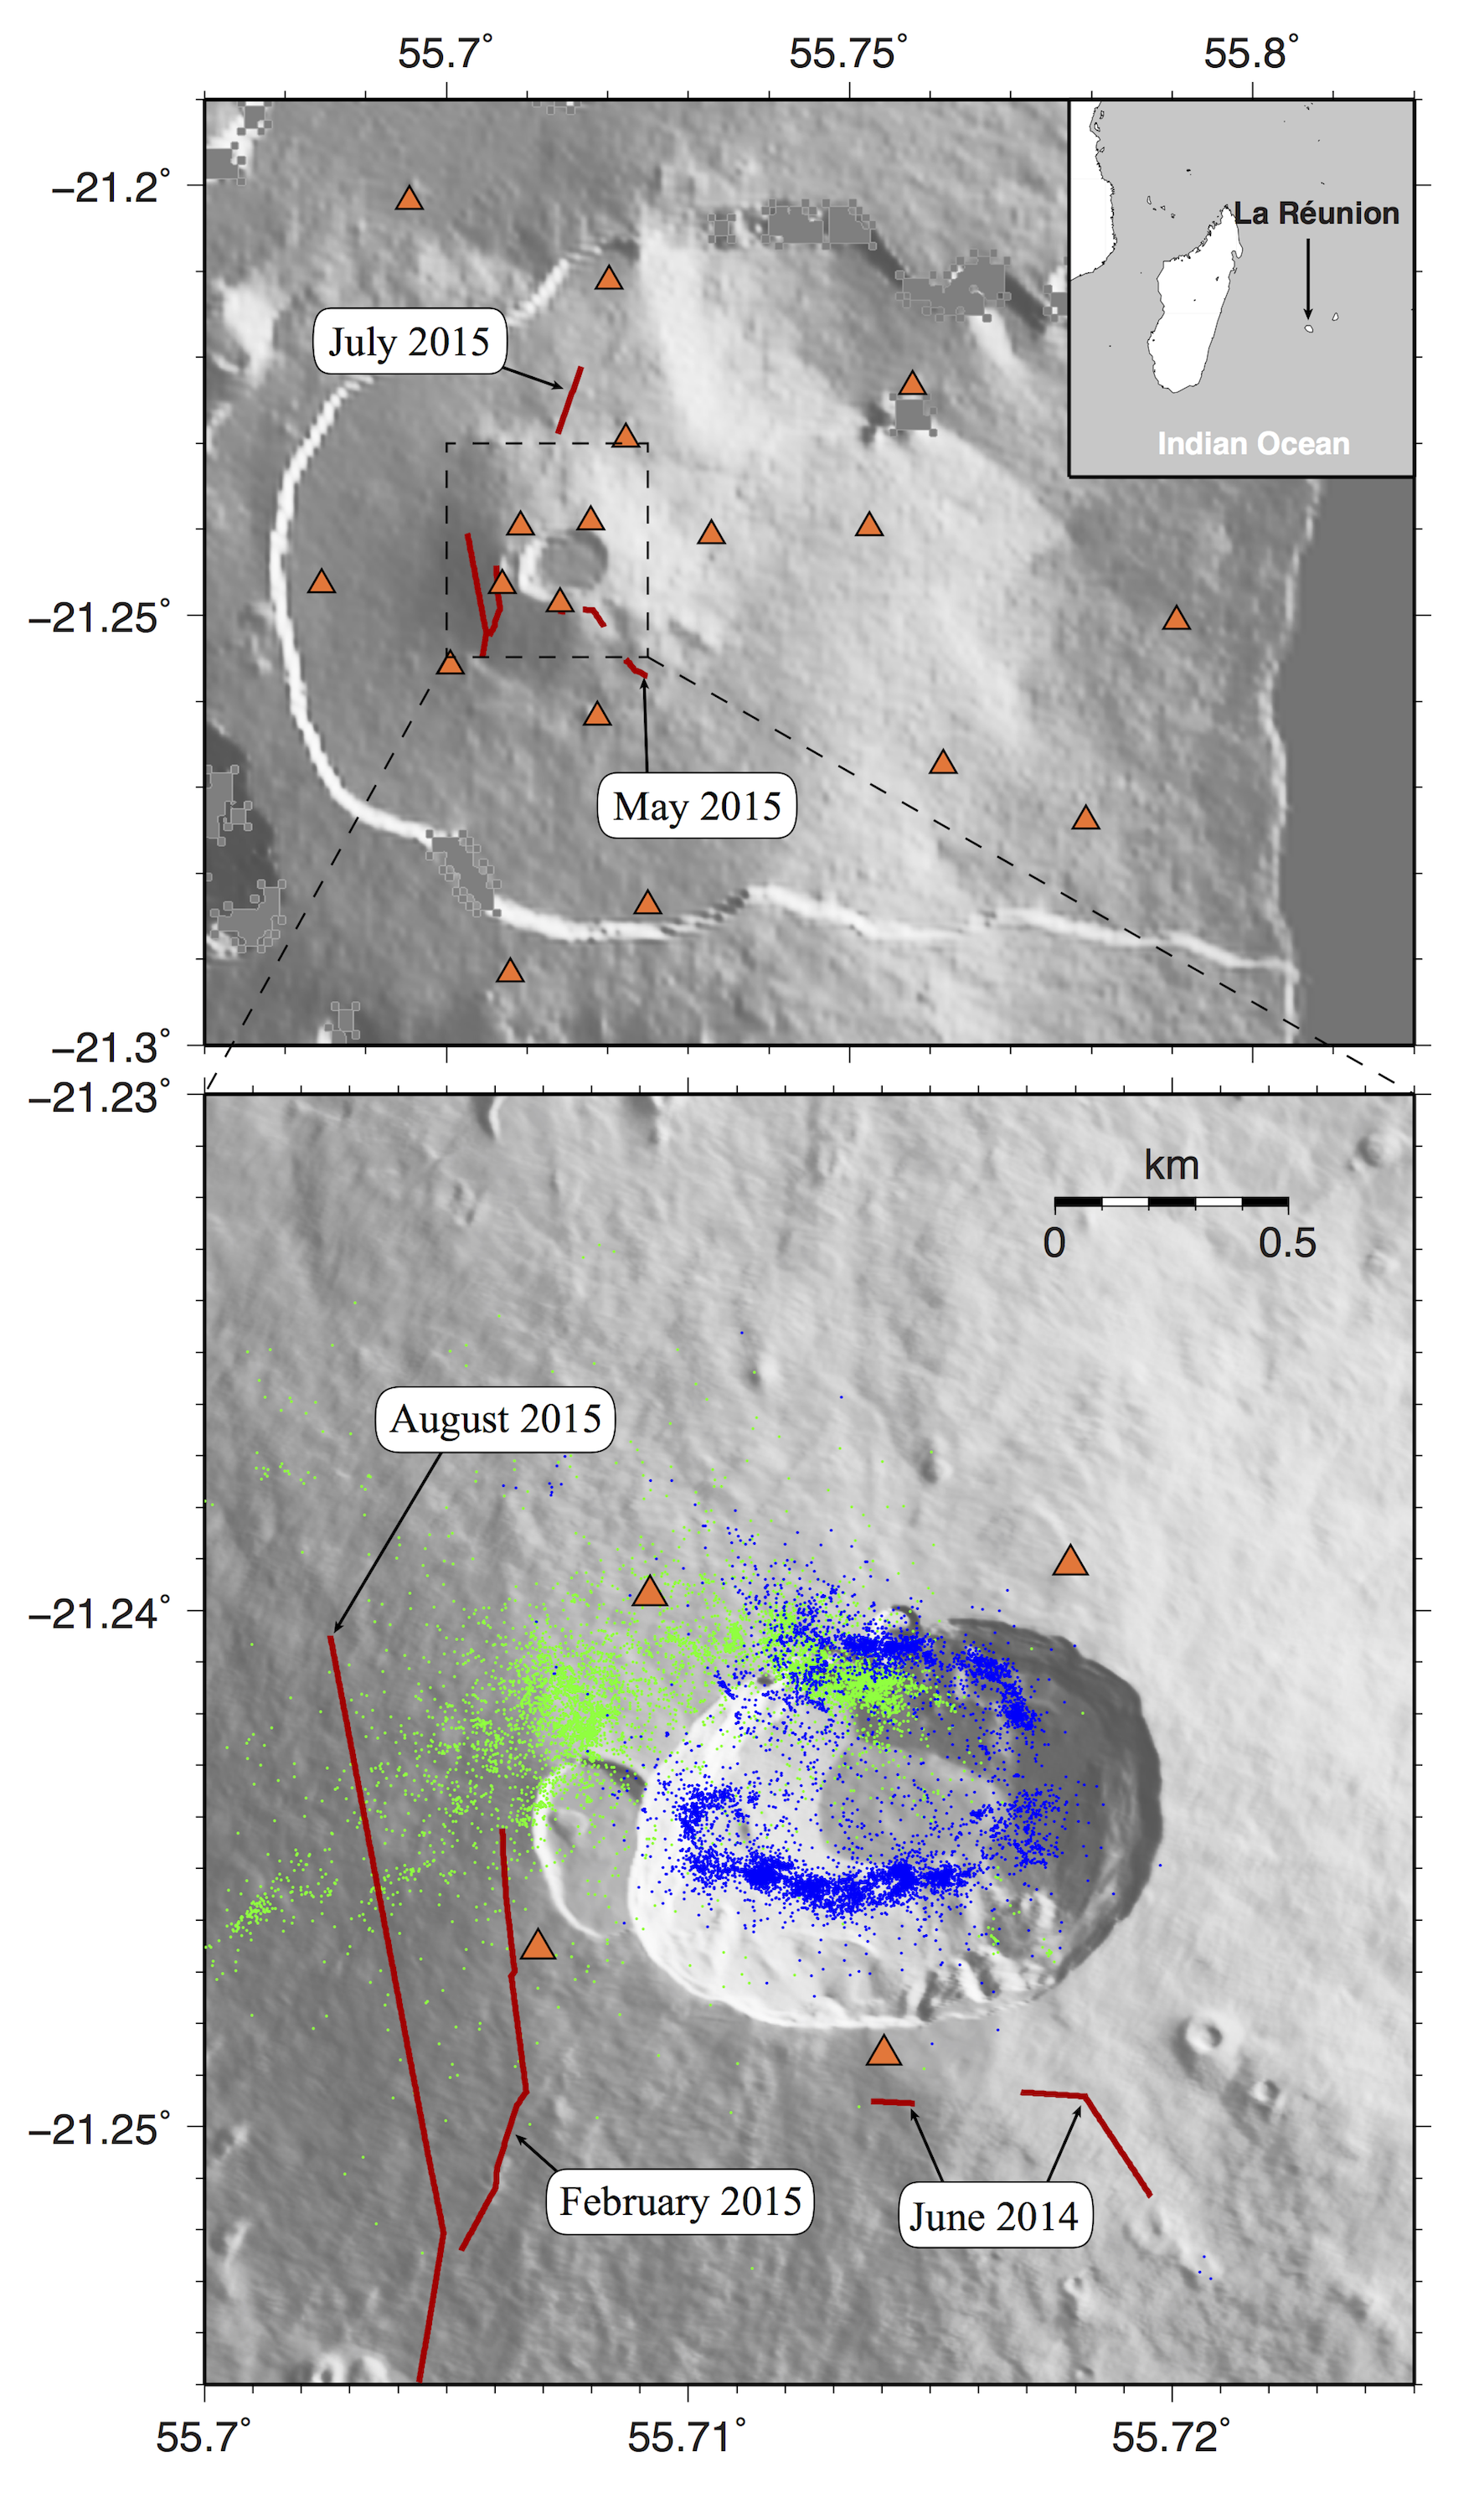
Piton de la Fournaise volcano - (top) Global map of the Piton de la Fournaise volcanic edifice. Orange triangles indicate seismic stations used in this study. Code names are indicated for stations used for event detection. The eruptive fissures of the five studied eruptions are indicated by red lines. (bottom) Same as the top subfigure with the location of all relocated shallow earthquakes (blue dots) and deep events (green dots) in 2014 and 2015.
In Lengline et al. (2016, cf. publications), we apply a template matching method to detect and locate pre-eruptive earthquakes at Piton de la Fournaise volcano in 2014 and 2015. This approach enabled the detection of many events and unveiled persistent seismicity features through multiple eruptions. Shallow earthquakes define a ring shaped structure beneath the main crater. The repetitive occurence of events along this structure suggests that it corresponds to a preexisting zone of weakness within the edifice. We also show evidence of deep magma transfer in 2015. More than 5000 deep earthquakes define an upward migration immediately followed by the occurence of shallow events leading to an eruption 20 days later. This suggests the creation of a hydraulic connection between the lower part of the volcanic system and a magma reservoir located near sea level. We can envisage that such replenishments of the shallow reservoir occured in the past but were undetected because of limited deep earthquake detections. 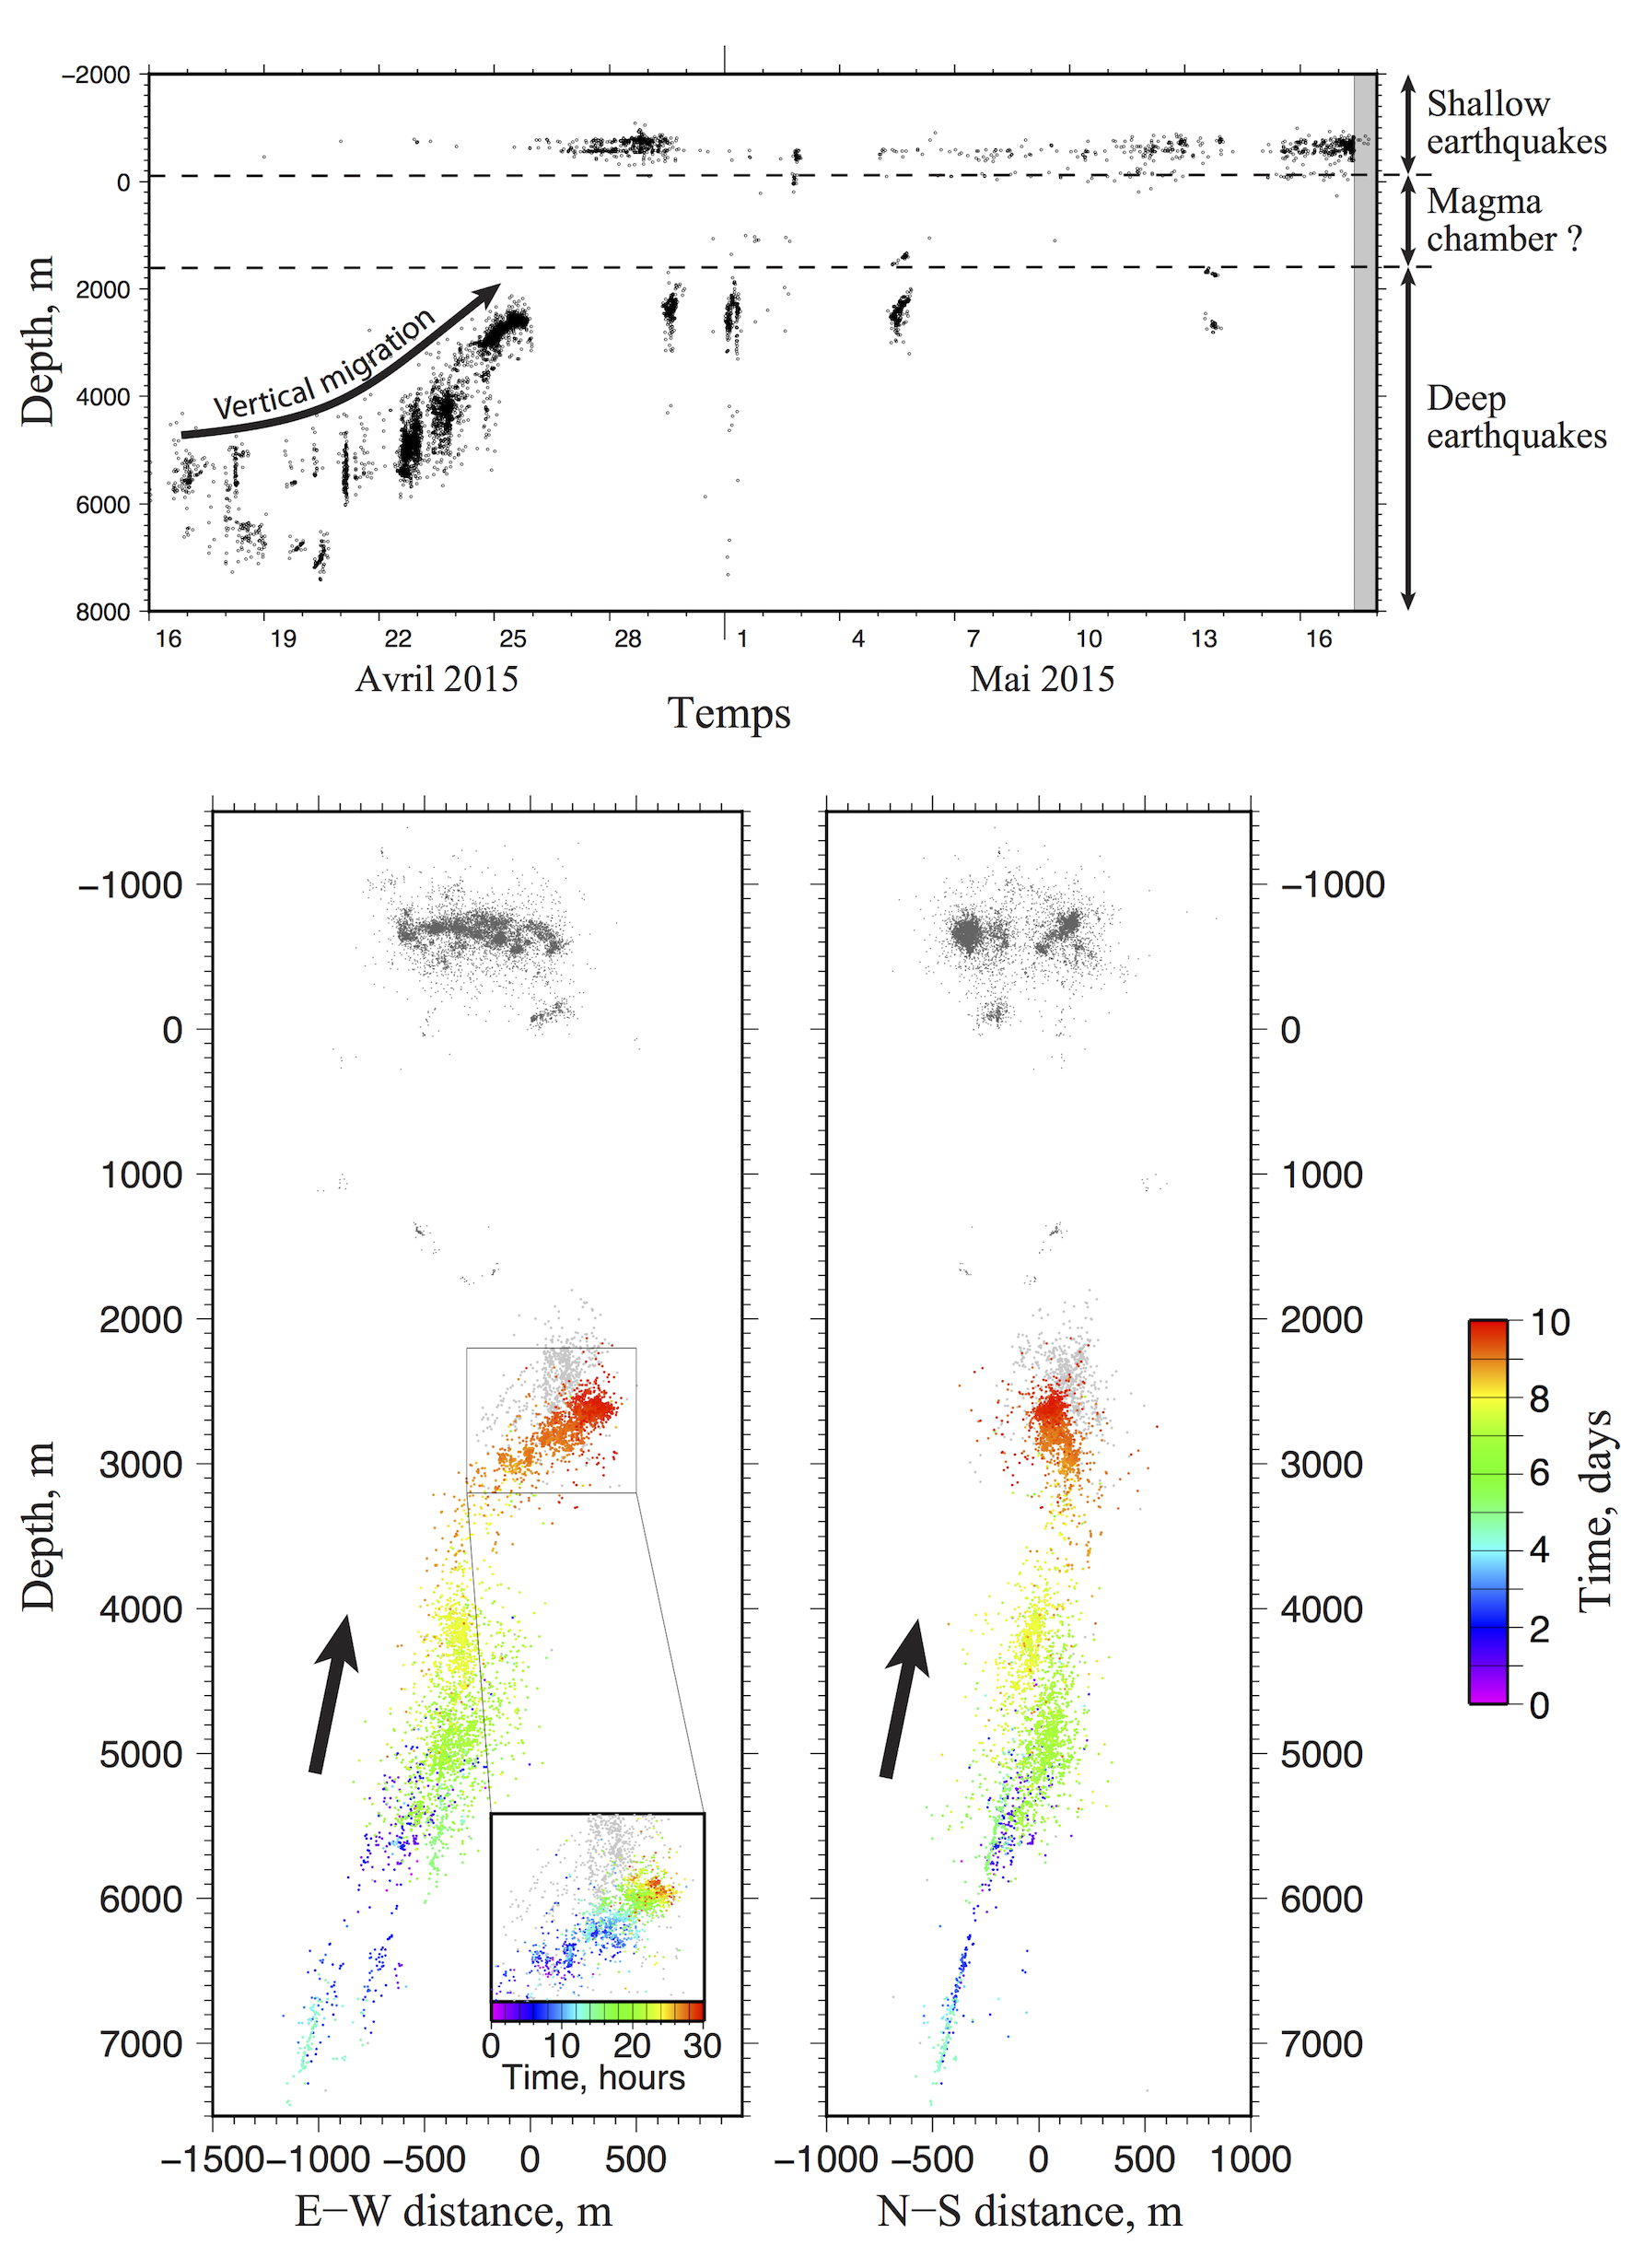
Distribution of earthquakes in space and time - North-Sout and East-West seismicity profiles under the Piton de la Fournaise volcano. Colored dots are earthquakes that occured within the first 10 days of the deep seismicity migration observed in April 2015. Grey dots are other events that we detected in 2014-2015.
Monitoring seismic velocity changes using background noiseThe earth is often affected by transient or permanent variation in its elastic properties. These perturbations will particularly affect seismic waves as they follow a complex path in the propagating medium. To take advantage of the larger sensitivity of scattered waves, Poupinet and Ellsworth (1984) proposed an interferometry method based on coda waves recorded before and after the perturbation. Even if this method allows to retrieve very small changes in the medium, the temporal resolution is generaly limited since the measurements are based the observation of co-located earthquakes (i.e., multiplets). In Brenguier et al. (2008) and Duputel et al. (2009), we proposed an alternative approach based on the background noise cross-correlations. Cross-correlation of background noise recorded at two seismic stations over a long time-period allows to continuously retrieve the Green’s function between the two observation points. The new approach that we proposed thus allows the continuous monitoring of small velocity changes (< 1%) using the coda retrieved from background noise cross-correlation. This method is particularly adapted to volcanoes since the volcanic erruptions are generally associated with changes of the propagating medium. 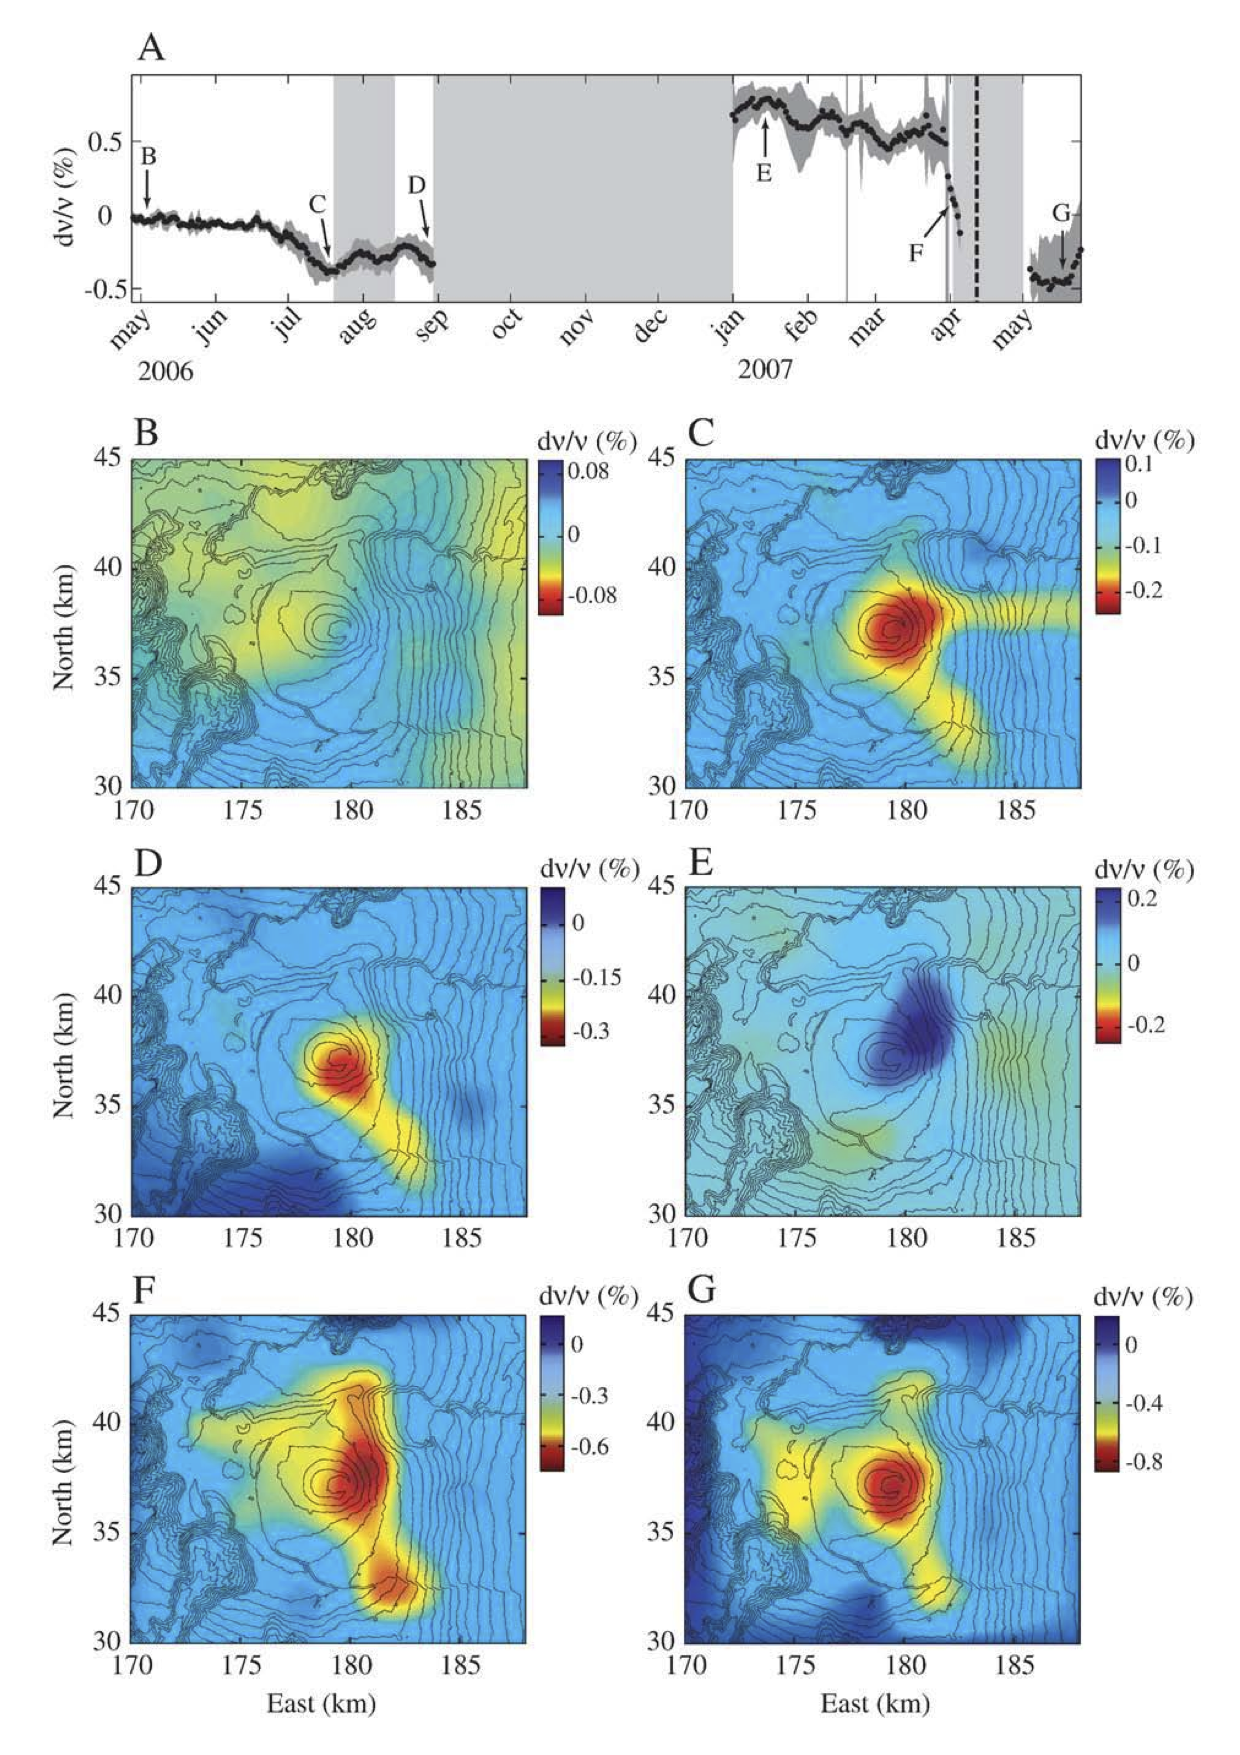
Relative velocity changes measured at the Piton de la Fournaise (La Réunion) from January 2006 to June 2007. Variations measured for the station pair bor-fer located in the central part of the volcanic edifice are presented in (A). Grey areas represent periods of eruption, the vertical dotted dark grey line in delimits a major collapse of the main crater (Dolomieu crater) which occured during the April 2007 eruption. Regionalization of temporal changes are shown in (B)-(G). The period taken for regionalisation maps are specified with the arrows and the corresponding letters.
The velocity changes are clearly correlated with the volcano-tectonic activity at the Piton de la Fournaise. The regionalization maps shown in the above figure suggest that the velocity variations mostly affects the central cone of the Piton de la Fournaise which is consistend with data from GPS extensometer and tiltmeter networks. This localization of velocity changes is also suggested by the figure bellow showing the azimuthal distribution of absolute velocity changes 10 days before the July 2006 eruption. 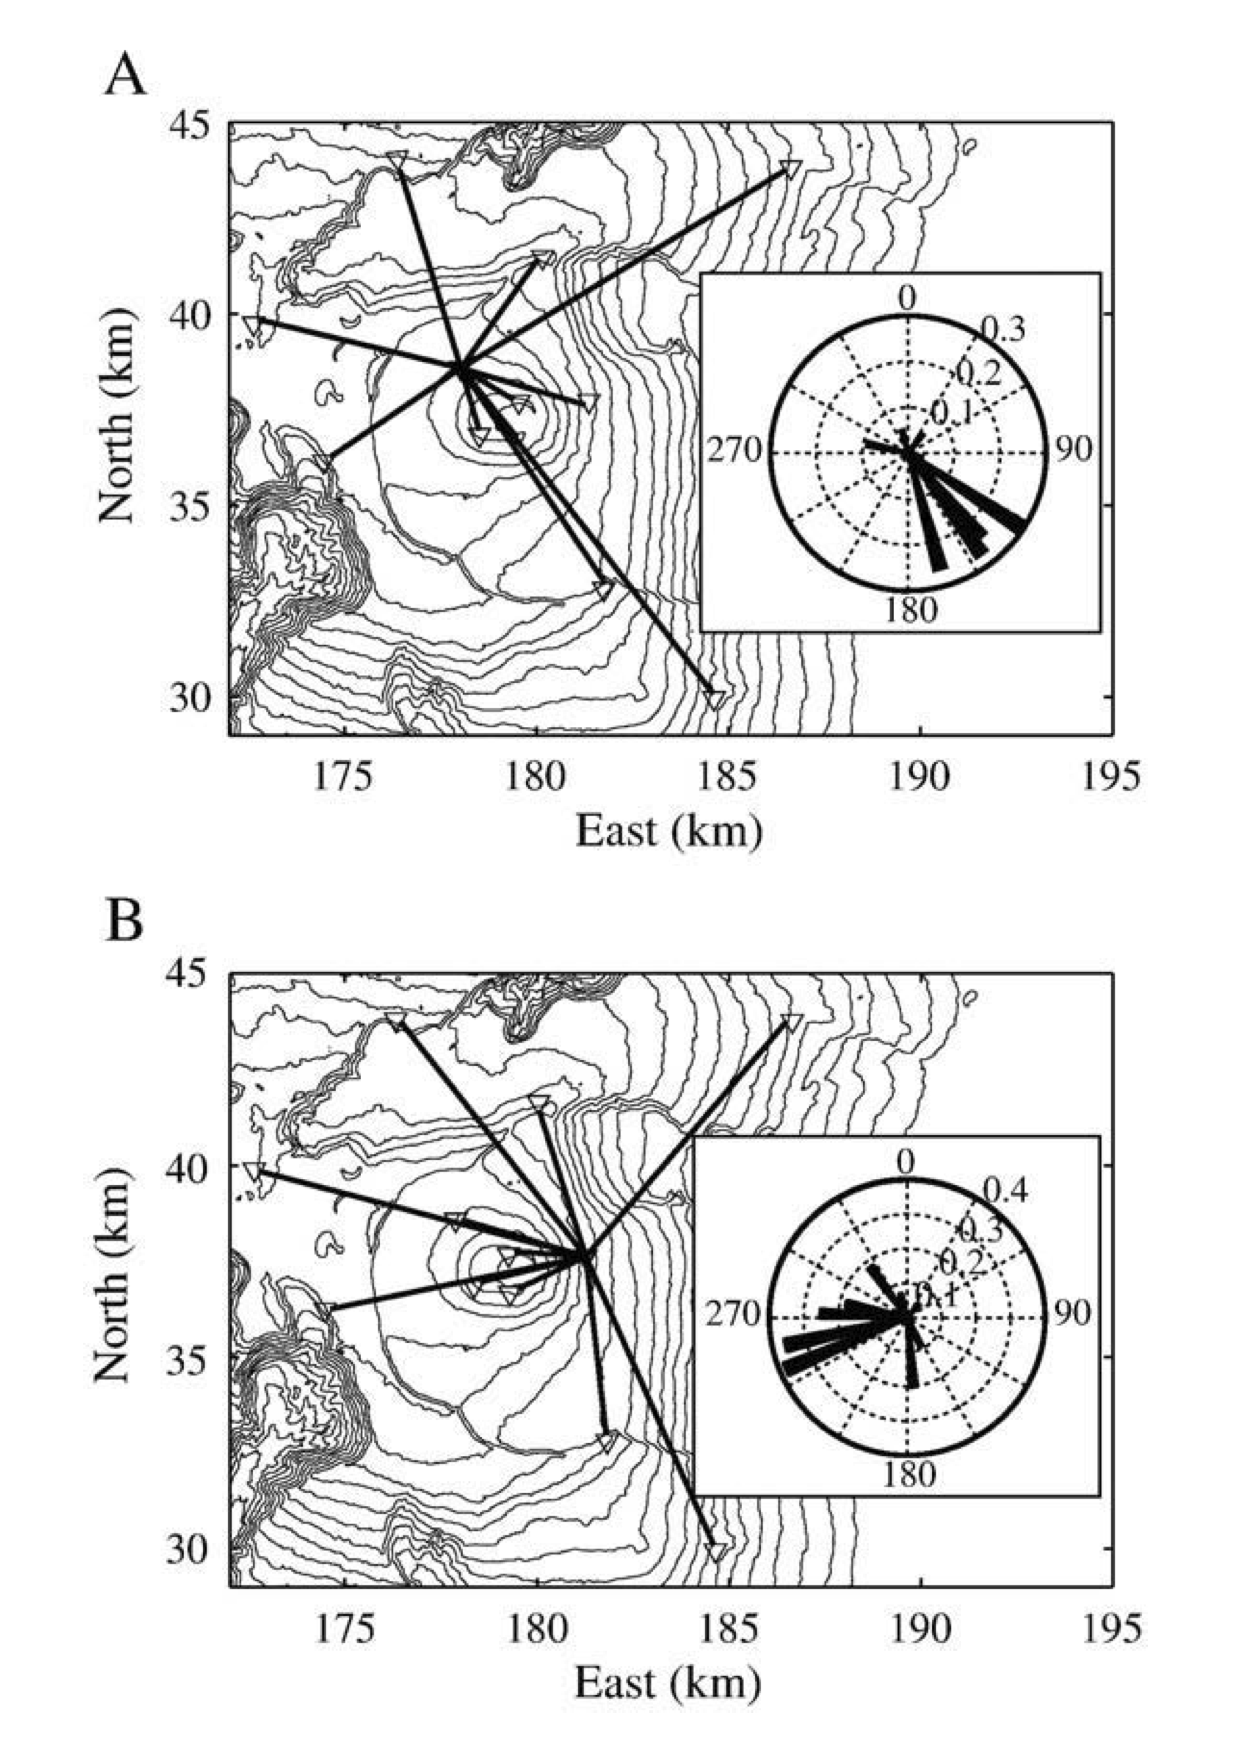
Distribution of absolute relative velocity changes as a function of azimuth for stations pairs containing (A) TCR or (B) fer. The cross-correlation function is averaged over the 10 days before the July 2006 eruption starts. Analysis and inversion of multimode Surface-wavesTo overcome the limitation of classical f-k analysis (or the equivalent p-f and f-c transforms widely used in near-surface geophysics), we propose an alternative wavefield representation in the group-velocity/phase-velocity (U-c) domain. 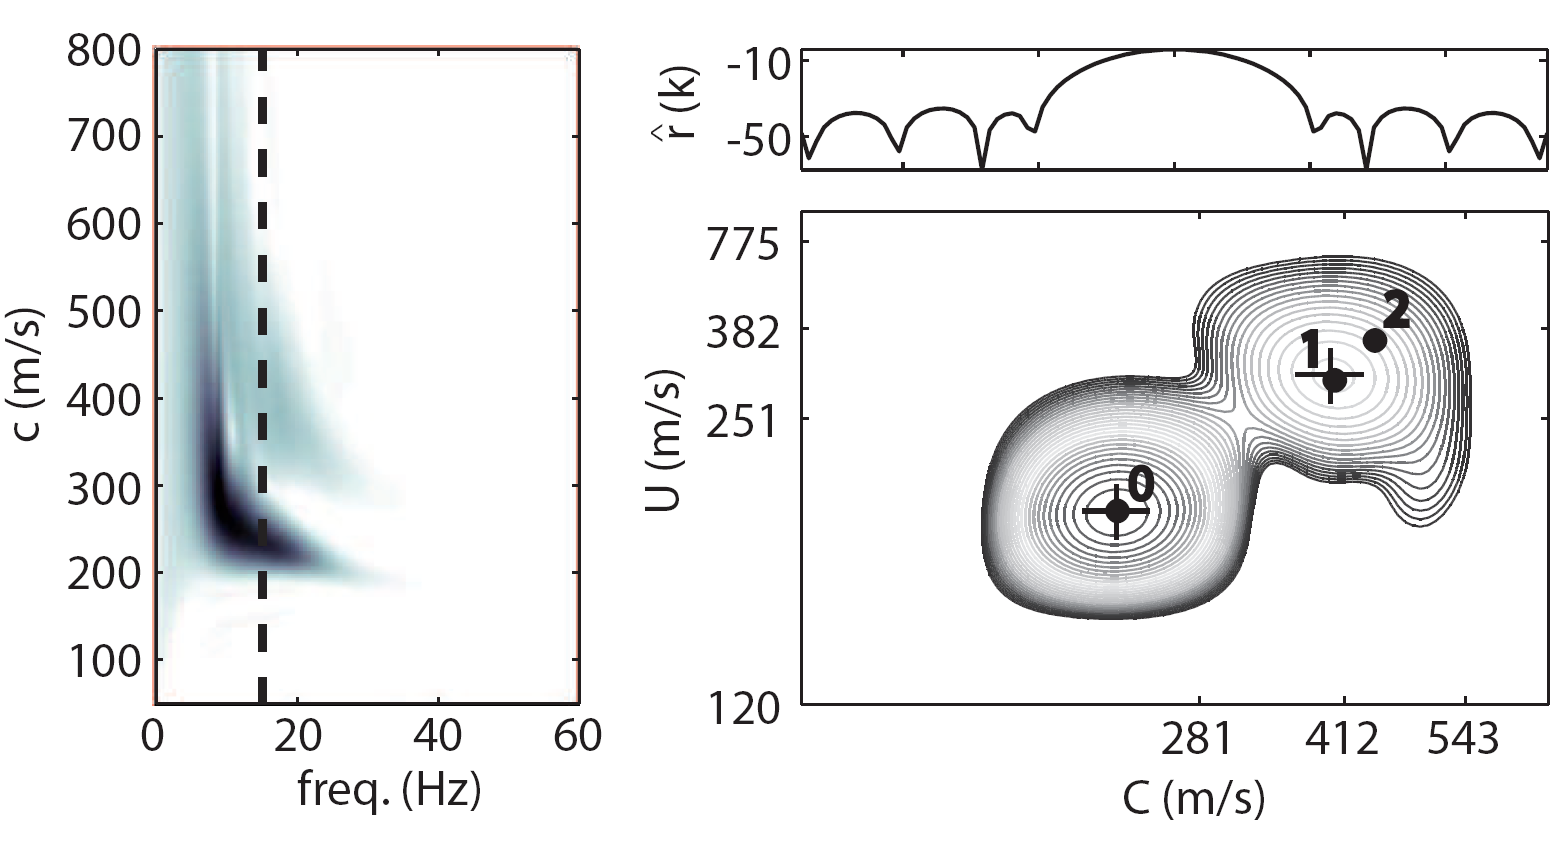
Comparison between (left) f-c diagram and (right) U-c diagram computed at f=15Hz (f: frequency, c: phase velocity and U: group velocity). We used synthetic waveforms generated by a surficial source and observed by a linear array. These synthetics were propagated through a simple 1D model of the subsurface. r(k) is the so called array response (here shown at f=15Hz). Black dots indicate the theoretical group and phase velocity values of the fundamental mode (0) and the first overtones (1-2). Crosses indicate the location of the peak maxima for mode 0 and 1. The fundamental mode and the first higher mode are clearly visible on the U-c diagram allowing a measurment of their group and phase velocities for different frequencies. On the other hand, the classical f-c transform is effective in estimating the fundamental mode phase velocity but fails for the first overtone which is too weak to be measured accurately. |
Contact Address:
IPGS - EOST Telephone:
+33 (0)3 68 85 00 39 Email: |
|
|
||

|
||