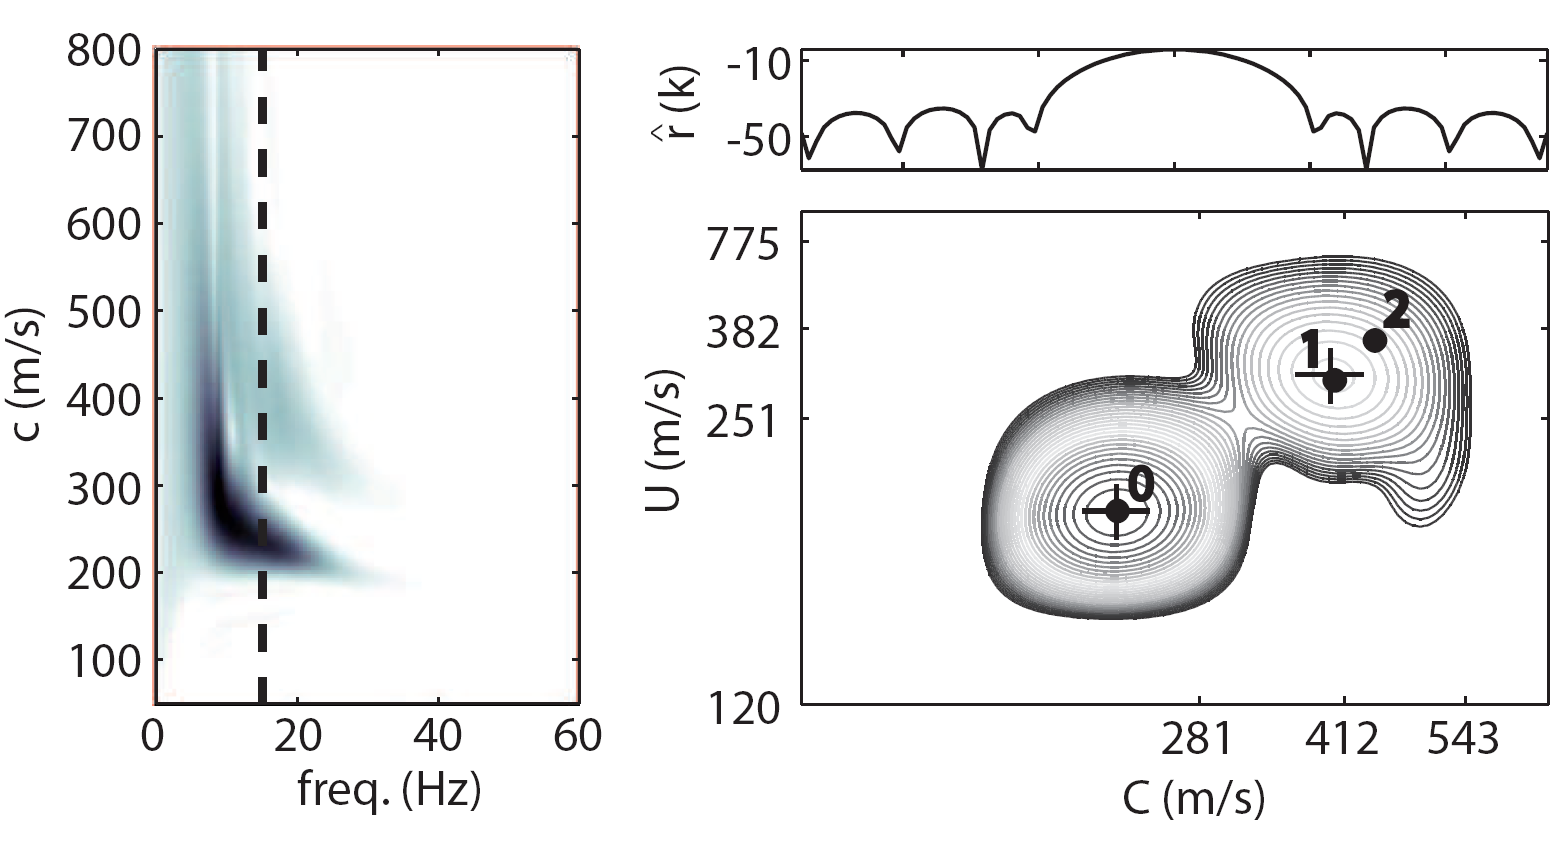
Comparison between (left) f-c diagram and (right) U-c diagram computed at f=15Hz (f: frequency, c: phase velocity and U: group velocity). We used synthetic waveforms generated by a surficial source and observed by a linear array. These synthetics were propagated through a simple 1D model of the subsurface. r(k) is the so called array response (here shown at f=15Hz). Black dots indicate the theoretical group and phase velocity values of the fundamental mode (0) and the first overtones (1-2). Crosses indicate the location of the peak maxima for mode 0 and 1. The fundamental mode and the first higher mode are clearly visible on the U-c diagram allowing a measurment of their group and phase velocities for different frequencies. On the other hand, the classical f-c transform is effective in estimating the fundamental mode phase velocity but fails for the first overtone which is too weak to be measured accurately. |